Create an Editable, Stylized Line Chart in PowerPoint
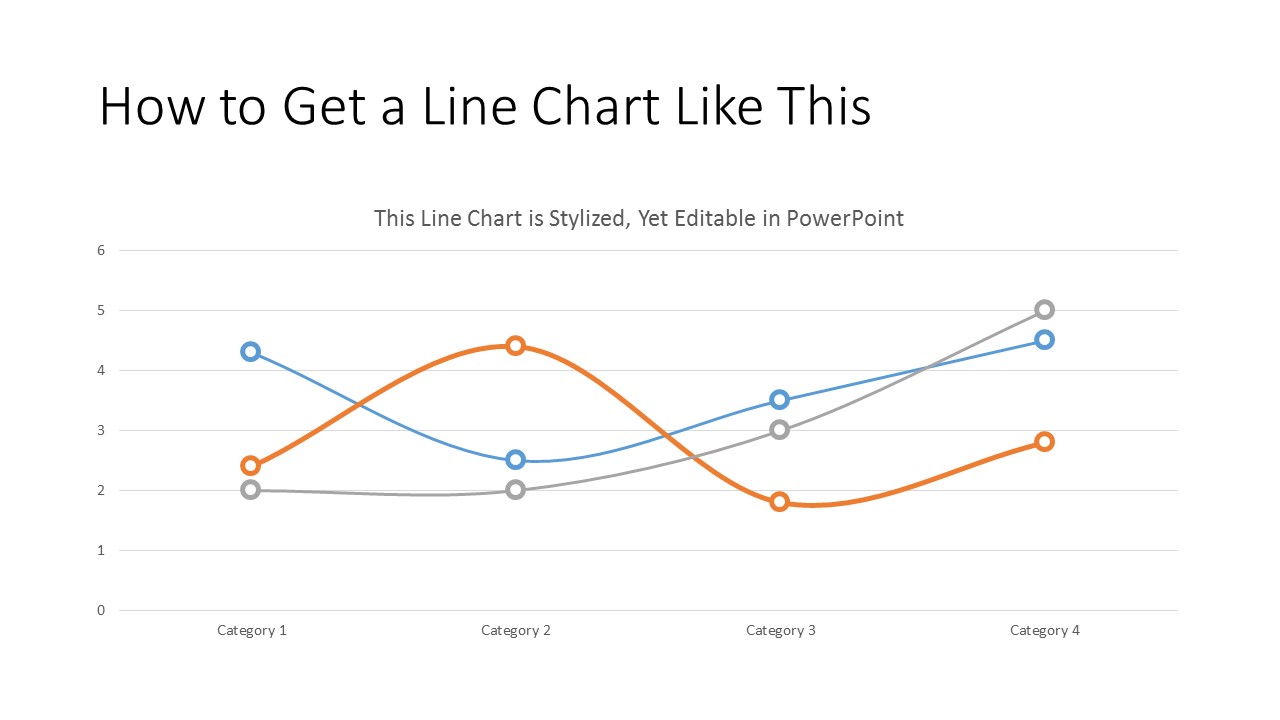
In this tutorial, you will learn how to create a stylized line chart like the one below for your presentations. Better yet, you’ll learn how to create an editable version of this chart in PowerPoint, making it easy for you to make data changes in the future.
This tutorial features PowerPoint 2013 (running Windows 8 on a Mac).
Step 1: Insert a line chart.
In the Ribbon at the top of the screen, go to Insert > Illustrations > Chart
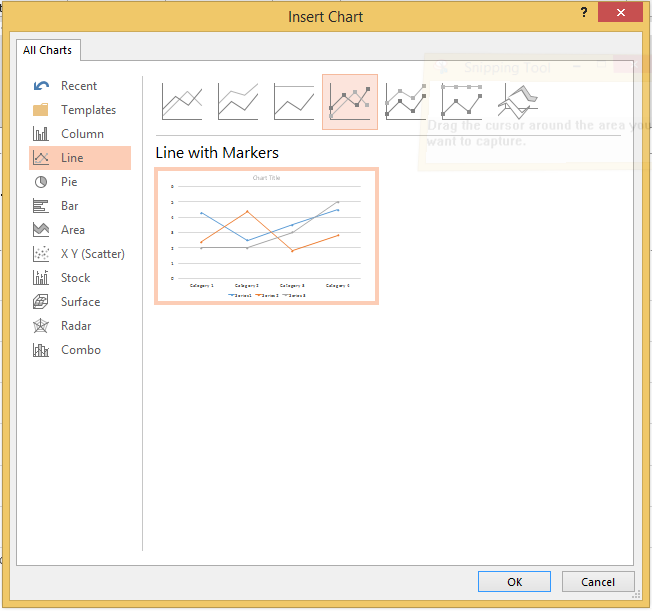
Insert Chart
In the Insert Chart dialog box, choose Line > Line with Markers
Step 1: Insert a Line Chart
Step 2: Create Smooth Line
Once the line chart is inserted, double click on one of the lines to reveal the Format Data Series Task Pane at the right of your slide.
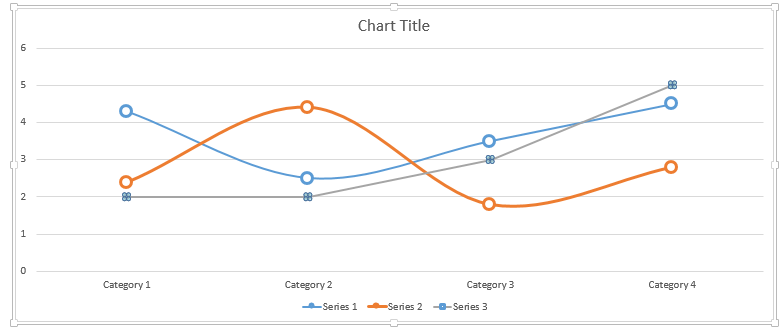
Click on the Fill & Line icon to open the Series Options dialog in the Task Pane. At the bottom of this dialog box, check the Smoothed Line option

Check the Smoothed Line option
Step 3: Format Markers
Near the top of the Format Data Series Task Pane, click on the Marker icon > Marker Options to open all Marker editing options.

Choose Marker
Under the Marker Option header, choose Built-in, then select the circle as the Type. Type in 13 for the Size.
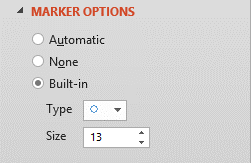
Marker Options
Under the Fill header, choose Solid fill. For the color, choose the same color as your background. If you have a complex background, you may want to choose No fill.
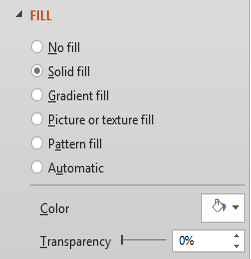
Choose a White Fill
Under the Border header, choose Solid line. For the color, choose the same color as your line. Make the width of your circle the same width as the line in your graph. In this case, the line width should be 2.25.
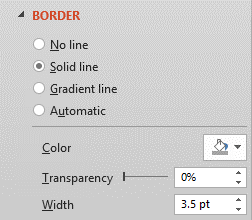
Choose Border Color and Width
Step 4: Repeat Steps 1 – 3 for all the lines in your graph
Coming Soon!
Save this chart as a template.